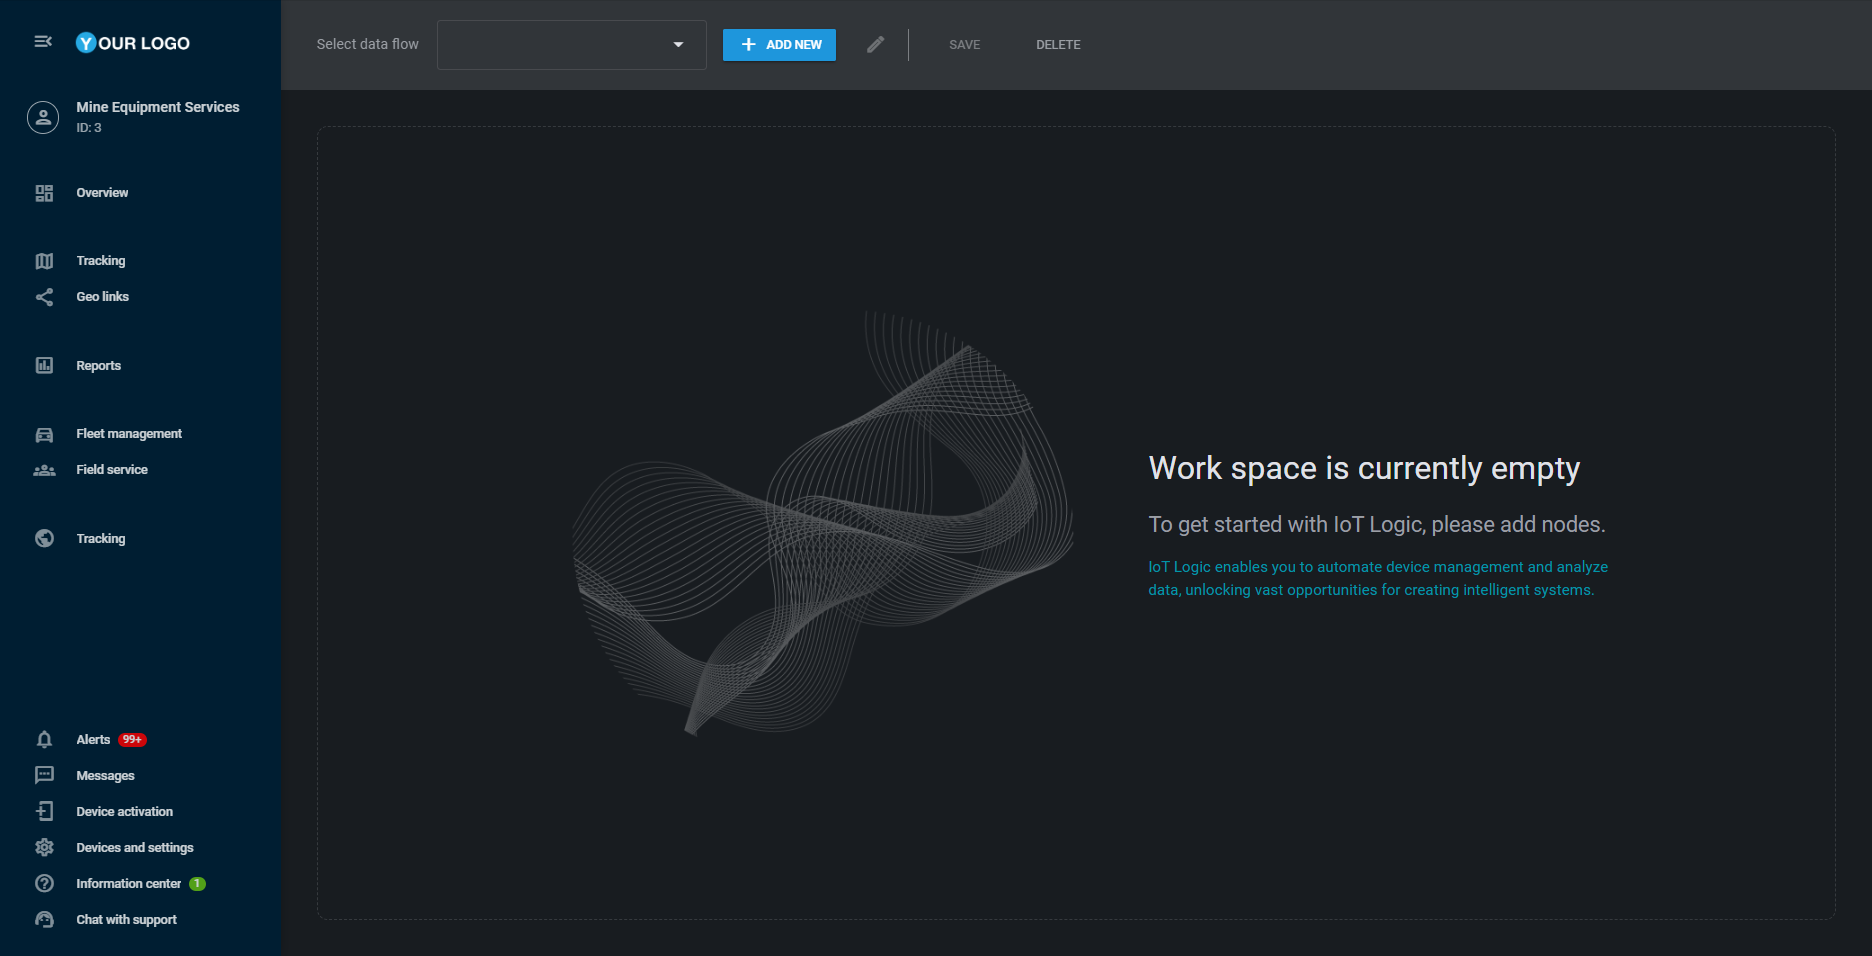
First view
Once you open the IoT Logic interface, you will still be able to open any other Navixy tabs if necessary from it so you will see the standard Navixy menu on the left.

The main IoT Logic screen has the next in its interface:

Select data flow: if you have some data flows created already, you can click on it and choose the necessary flow for work from the dropdown.
Add new: this button opens the Flow creation window where you can specify all information about your new flow.
Pencil button: once you select a flow, this button will be active so you can edit flow information like name, description and switch it on/off.
Save button: if you change something in the flow, don’t forget to save. If you changed something accidentally just reload the page.
Delete button: if you don’t need some flow anymore, you can delete it from the platform.
Debug mode: this button will open the Monitor tool which will help you see data from different sources and attributes and will be useful for diagnostics.
