Fuel volume report
The Fuel Volume Report in Navixy offers comprehensive insights into fuel usage across your fleet, providing crucial data on fuel volume changes, refueling events, and fuel consumption over a specified time period.
This report is essential for fleet managers aiming to monitor fuel efficiency, detect potential fuel theft, and manage fuel costs effectively. Below is a detailed guide on how this report works, the parameters involved, and how to interpret the data.

Overview
The Fuel Volume Report is composed of several sections:
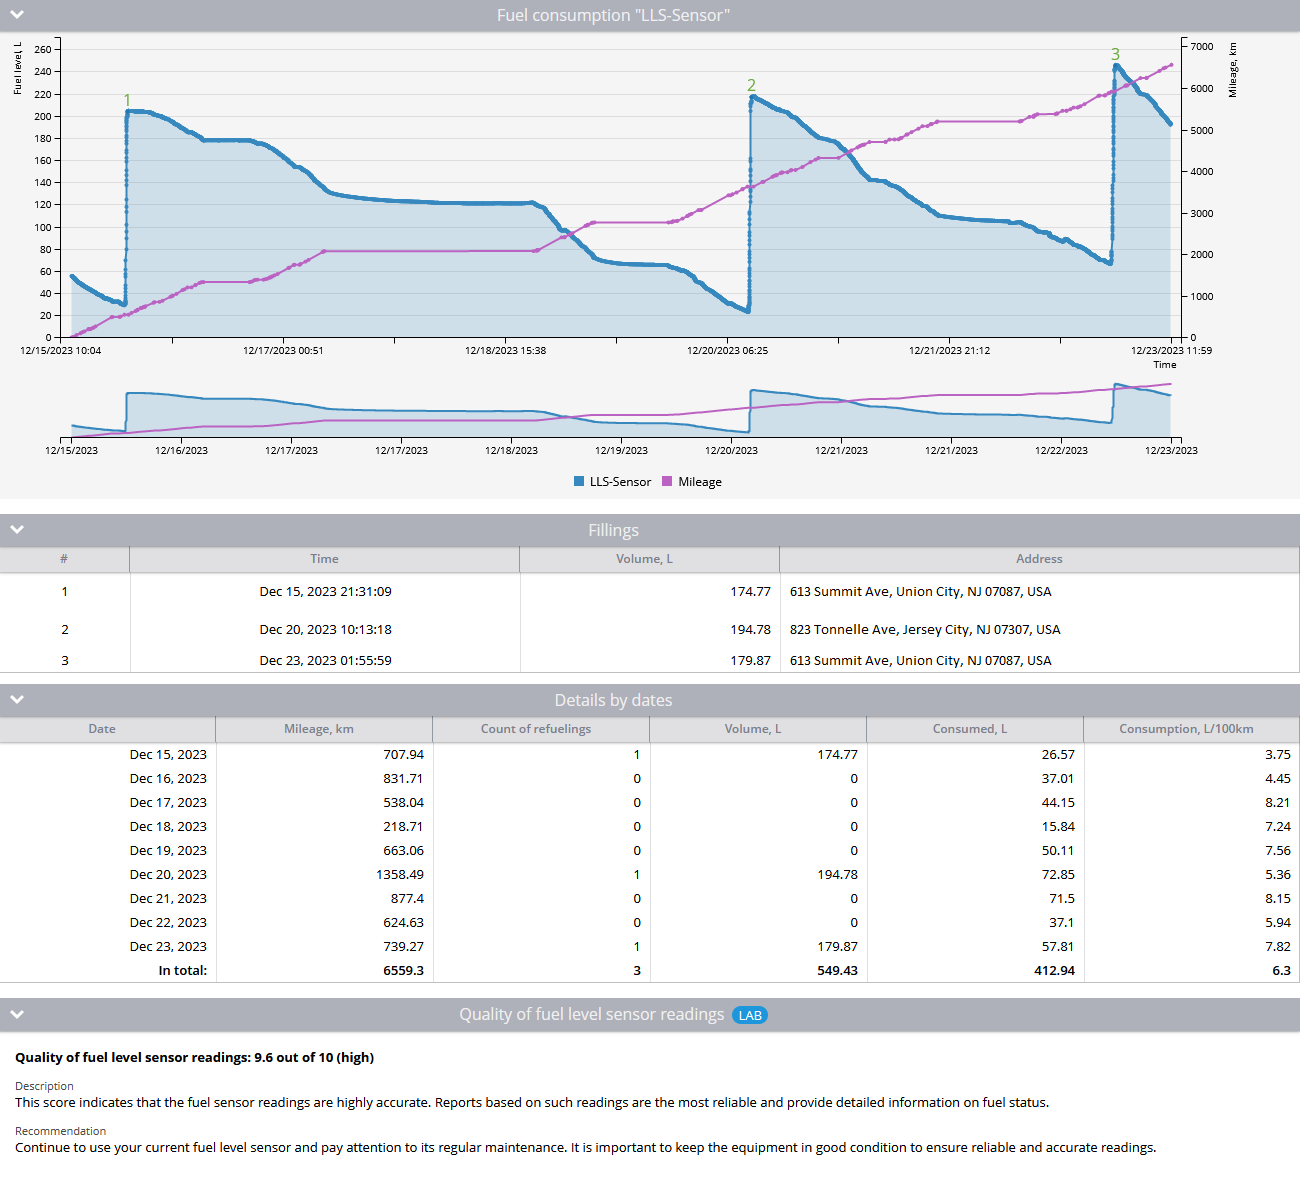
Graph of change in fuel volume: A visual representation of fuel level changes over time.
Fillings table: A detailed list of refueling events, including the time, volume, and location of each filling.
Details by dates table: Daily summaries of fuel volume changes, including mileage, refueling counts, and fuel consumption calculations.
Assessment of fuel level sensor qualityLAB: An experimental feature that evaluates the accuracy and reliability of fuel sensor data. See also: Enhancing fuel management accuracy with Fuel Sensor Quality Index.
Key features and use cases
The Fuel Volume Report can be used in various scenarios:
Monitoring fuel consumption: Track fuel usage and identify patterns or anomalies that could indicate inefficiencies or potential fuel theft.
Evaluating sensor accuracy: Assess the performance of fuel level sensors to ensure reliable data collection.
Fuel fraud detection: Identify unusual refueling patterns or locations that may indicate fraudulent activity.
Report parameters
To generate an accurate Fuel Volume Report, ensure that the following configurations are correctly set up:
Fuel level sensor calibration:
For a single fuel level sensor, ensure that the calibration table is filled out according to the manufacturer's recommendations. Additionally, set thresholds for emission filtering in the "Advanced" section under the calibration table.
For vehicles with multiple tanks, calibrate each sensor separately and create an aggregate sensor with volume units set to liters or gallons. Avoid using "Custom Option" in the sensor's Unit of Measure setting.
For sensors that report fuel levels as a percentage, calibration is also required, with minimum and maximum fuel volumes specified.
Sensor data processing:
The platform collects raw data from devices and fuel sensors, which is then filtered based on the ignored values set in the sensor settings. The platform records data as received, without modifying it.
Graph generation:
The platform generates a graph of stored values based on the report parameters. Fuel sensor settings, including threshold values, are applied to this graph.
Automated smoothing:
The process of smoothing the graph is fully automated, with all smoothing and filtering settings applied automatically to produce a user-friendly, readable chart.
Detailed report sections
Fuel volume change graph:
This graph presents the fuel level sensor readings over time. If multiple sensors are used, the graph will display data from the aggregate sensor only. Refueling events are numbered and plotted at their corresponding points on the graph.
Fillings table:
The table lists all refueling events during the selected period, including the date, time, fuel volume, and location.
Details by dates table:
Provides daily data summaries, including:
Date: The specific day for which the data is calculated.
Mileage: The distance traveled on that day.
Count of Refuelings: Number of refueling events.
Volume: Total volume of fuel refilled.
Consumed: Actual fuel consumption for the day, calculated as
initial fuel level + volume of refuelings - final fuel level.Consumption per 100 km: Fuel consumption per 100 km, calculated as
(initial fuel level + volume of refuelings - final fuel level) / mileage * 100.
Assessment of fuel sensor reading qualityLAB:
This section evaluates the quality of the fuel sensor readings, providing a quantitative score (1.0 to 10.0) and a qualitative rating (low, medium, high) based on the noise and accuracy of the sensor data.
The system may display a message indicating insufficient data for quality assessment if the sensor has been recently installed or if the data collection period is too short.
Insights from the report
The Fuel Volume Report can reveal critical insights, such as:
Fuel fraud detection: Identifying discrepancies between reported refueling events and actual fuel usage, particularly at fuel stations.
Operational efficiency: Analyzing fuel consumption relative to mileage to identify potential inefficiencies or areas for cost reduction.
Sensor performance monitoring: Regularly assessing the accuracy and reliability of fuel sensors to ensure that the data used for decision-making is trustworthy.
